
Forecasting revenues for solar farms operating in the wholesale market is quite challenging, and there are many opinions on the topic. Increasingly, the solar industry is seeing a rise in mid-scale solar projects, often funded by smaller energy conscious corporates or community energy groups. With this comes a need for more accessible avenues of revenue forecasting. It is possible to engage consultants who model every 30 minutes for the next 20 years, based on expected bidding by various generators, and expected reductions in coal power capacity and increases in solar and wind capacity. But these are expensive and are always wrong. This blog does use data, but also utilises energy market judgement built from following the market over the past decade.
There is a lot of commentary on the National Electricity Market, or the NEM, which covers our interconnected grid from Queensland down to Tasmania and across to South Australia. But each region has its own wholesale price and dynamics.
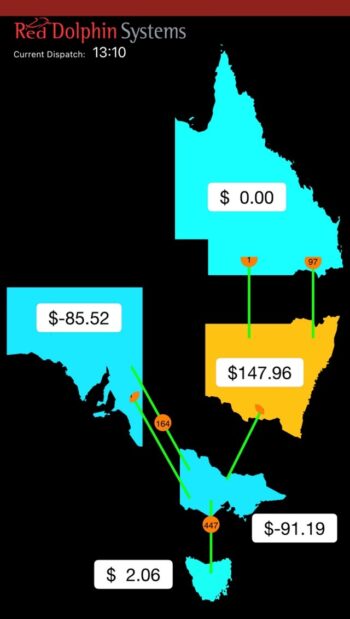
South Australia is now over 70% renewable with 20-30% solar and 40-60% wind, depending on the week or year. This means there is an abundance of wind and solar generation, which can mean much lower revenues for wind and solar farms, when it is windy and solar. We operate in a market, and when supply is high in a 5-minute period or a day, the price the generators receive is lower. This can even see the price going negative at times (see image above), meaning generators get billed for generating power, or at least their monthly earnings are reduced.
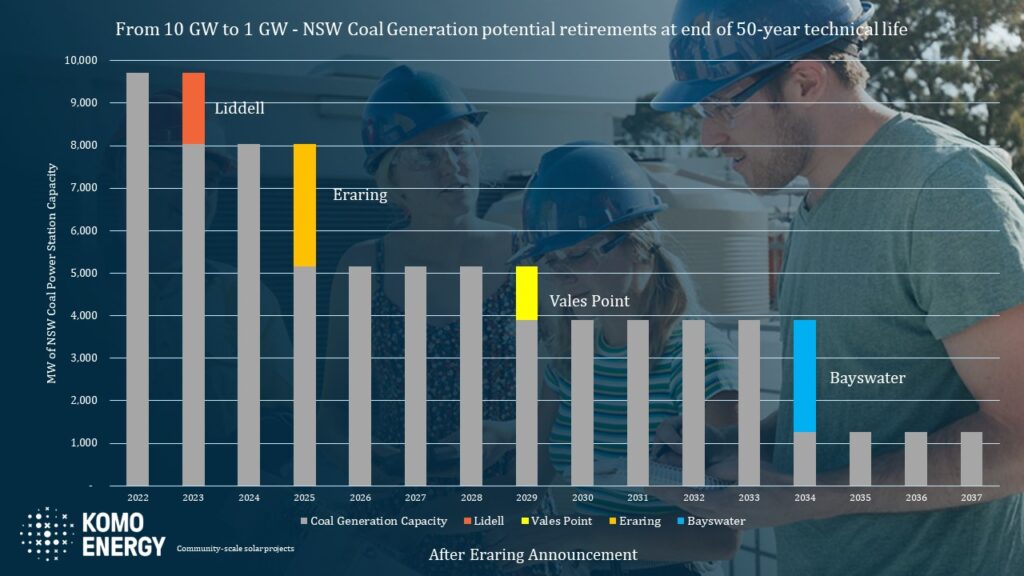
In comparison, NSW has very different dynamics. In 2022 NSW was 12% solar powered and only 8% wind powered. NSW does reach up to 70% renewables at times, but generally there are less times of abundance. NSW also imports more power and has pumped hydro to soak up renewables, both factors that reduce low or negative prices. Crucially, NSW’s coal power stations are planned to retire in the near future, reducing coal power capacity of nearly 10GW currently, to 1.5 GW by 2035. This lack of supply suggests more elevated pricing in the future compared to South Australia for example.
It is difficult, maybe impossible, to predict the future wholesale prices in the NEM. One data point we do have is ASX Baseload futures for the next 3 years. Baseload futures are traded between large energy generators and large energy buyers. Generators prefer to pre-sell their power for future years to know their revenues and budgets. Electricity retailers, like your home electricity retailer, often buy their power for coming years so they can provide fixed price electricity to their household and business customers.
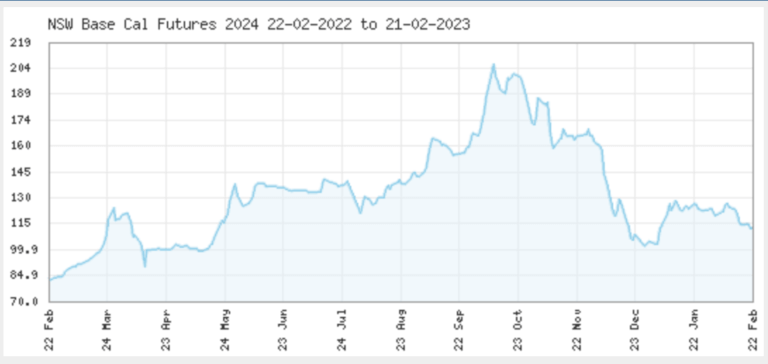
Currently the ASX Baseload futures suggests the average wholesale price for electricity in the NSW wholesale market is between $110 and $130.

While ASX Baseload futures are a great data point, based on supply and demand of very sophisticated buyers and sellers, they are also always wrong. Wholesale electricity baseload futures for this year (2023) were trading as high as $260 per MWh. Average wholesale electricity prices aren’t likely to be $260 per MWh in 2023 based on average pricing so far, and the trading of 2023 power late in 2022. 2024 futures were also trading as high and are now trading at $120 per MWh. Comparatively, 2022 futures were trading as low as $55 per MWh and ended up at $200 per MWh. Each trade of future power shows the previous day’s trade to be incorrect. The graph below shows how 2024 NSW baseload futures have changed in price over the past 12 months.
Another interesting data point is historic pricing. Here are the last 14-year average annual prices in NSW:

This table shows how energy prices change over time, depending on supply, demand and other dynamics.
In 2017, rooftop solar and solar farm generation combined provided 2.9% of NSW’s electricity. In 2022, this rose to 14.7%. At times in the middle of the day, solar can supply over 60% of NSW’s electricity. The graph below from OpenNEM shows a week of electricity demand and power generation, with solar providing 22% in this sunny February week. On Thursday the 16th of February at 11:00am, solar supplied 60.7% of NSW generation.
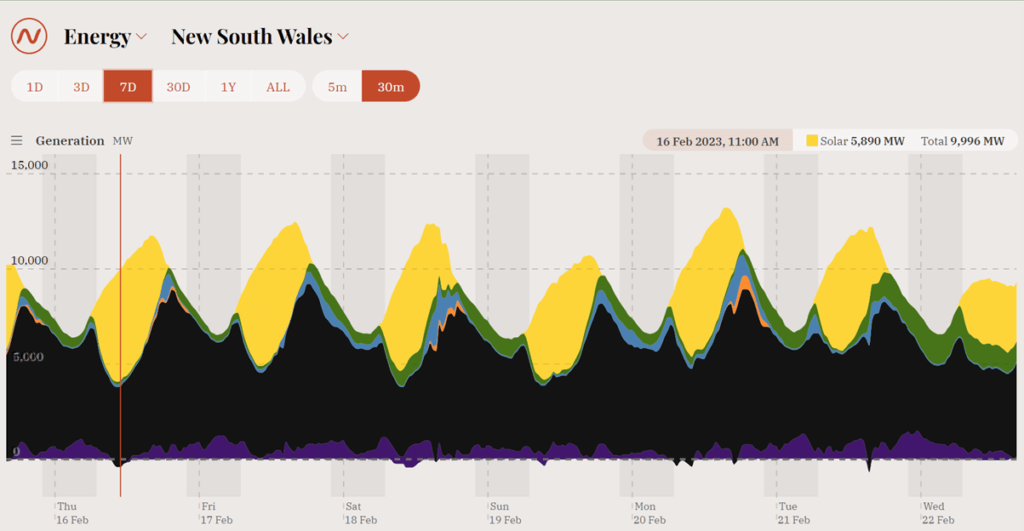
This abundance of supply sees the NSW pool price reduce compared to times of day where there is less solar supply. At these times, coal power stations ramp down their production (but continue operating at minimum levels), hydro and gas does not generate. If the price goes negative, wind and solar farms also ramp down their production.
The price that a particular generator receives in the wholesale market is called the “Generator Weighted Average Pool Price” or GWAP. The table below shows the annual average NSW wholesale price of electricity in recent years, and also shows the average (reduced) price that NSW solar farms receive in these years, and the discount they are being paid compared to the average.

As you can see, the discounted revenue solar farms receive gradually increased from 2017 as more rooftop solar and solar farms came online. 2021 saw a significant increase due to nearly 2GW of solar farms connecting and generating in that year, relatively cool weather and not too much energy market volatility.
As an aside, solar farms generally get slightly better GWAP than rooftop solar in terms of wholesale market pricing as many use tracking, seeing more morning and afternoon generation, when prices are generally higher. Additionally, solar farms are placed in regional locations with more consistent solar, and often continue generating at high levels when it is cloudy on the coast and moderate prices are maintained. A new trend is emerging which sees wholesale prices in NSW go much higher in winter for various reasons. Typically, regional solar farm production suffers less in winter than rooftop solar in more coastal population centres.
As above, the ASX Baseload Futures provide an interesting data point for expected wholesale prices for the next 3-4 years. Liddell Power Station completes its closure in April this year (2023). Eraring Power Station is announced as closing in 2025. Combined, these power stations historically supply around 30% of NSW’s power. So, their closure will significantly reduce supply and one would expect this will see higher prices until more wind and solar comes online.
Due to the current high electricity prices, rooftop solar is likely to be installed at its current high levels. Solar farm investment in NSW has slowed compared to the boom levels of 2020 and 2021 which saw some 2 Gigawatts connected . Wind farm investment is also slow with projects held up in approval processes. The first Renewable Energy Zones in Orana Central West and Armidale will take time also.
The new 800 MW interconnector between South Australia and NSW will bring additional supply to NSW. There are other interconnector upgrades planned between Queensland and Victoria. Snowy 2.0 with 2GW of peaking capacity was initially announced to take 4 years and be completed by 2021. It is now planned to take 11 years and be completed by 2028.
In summary, there is no short-term relief expected to the current high prices, and with Liddell and Eraring coal power stations retiring in the next 2-4 years, prices may go up. In the medium term, Renewable Energy Zones, new transmission and new generation and storage will add more supply and cap price increases as they are constructed and commence operations.
Looking Forward – Discounted Solar Revenues
To guide us for the future, it is interesting to look at the solar discounts other states are observing. With its very high levels of solar and wind power, South Australia is a good guide to how solar revenues may develop. The table below shows the observed average wholesale prices, solar revenue prices and discounts in the past few years:

It can be seen in this table that the revenue discount that Solar Farms in South Australia receive is significant, but has its limits. There is a caveat on this data: during negative prices South Australian Solar Farms often reduce their output, seeing less generation and revenue over the year. This increases their GWAP compared to continuing to generate during negative prices. As the large South Australian Solar Farms have PPAs, they likely continue to generate during moderate negative prices, and mostly ramp down during more extreme negative prices or when directed by AEMO for system security.
NSW has existing Tumut (900 MW) and Shoalhaven (250MW) pumped hydro that soaks up cheap renewables through pumping, particularly when there are high peak prices expected later in the day. Snowy 2.0 will add 2,000 MW of pumping in 2027/2028. Snowy 2.0 could potentially become one of the biggest electricity customers in the NEM if its pumping and hydro generation is used often. This will add demand to daytime solar, and will reduce negative prices or support higher daytime prices. Increased EV charging during cheap daytime hours could also support more sustainable daytime wholesale prices and reduce the discount solar receives.
In conclusion, the discount that solar receives is likely to continue and increase in the coming years due to more incoming solar, however once Snowy 2.0 comes online, this discount should immediately decrease.
Any forecast will be wrong. Whether it is this author’s view based on historical and market data and energy market experience and judgement, or whether it is a forecast produced by a supercomputer.
The table below sets out my best forecast based on the information presented above.
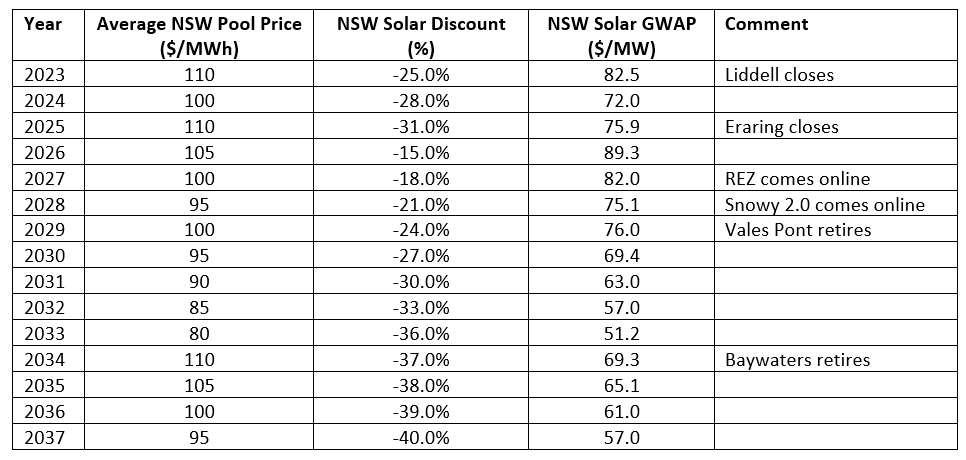
Of course, this will be wrong. The biggest way it will be wrong is it will be much more volatile than these estimates, with likely leaner lower years and much higher years. Solar and wind farms have to plan their cashflows with higher and lower revenue scenarios to account for this volatility and remain agile.
Generally, investors in new wind and solar farms are fearful of and expect future low prices, but customers are fearful of and expect future high prices. They can’t both be right! I hope these numbers help others investigating solar farms. If you have any comments on the logic, analysis or results, please get in touch! We remain open minded that things could be much different.
Solar Farms have two streams of revenues, wholesale electricity sales and LGC sales. LGCs are Large Scale Generation Certificates, a form of Renewable Energy Certificates administered by the Australian Federal Government as part of the Renewable Energy Target. LGCs are also forward traded so we have some data on expected LGC prices up to 2026 via the Mercari website.
In September 2020, 2024 LGC prices were being traded at $8 per LGC. Now they are being traded at $40. It is speculated that the rise in LGC prices has been due to delayed connections and lower than expected generation of new large-scale wind and solar farms. This is in addition due to rising voluntary corporate demand for LGCs to meet their sustainability commitments.
At this stage, the Renewable Energy Target finishes in 2030. This will reduce demand for LGCs as the mandatory purchase of LGCs by retailers for 20% of their electricity will be eliminated. However, we expect Renewable Energy Certificates or LGCs will continue in some form.
The table below shows the future LGC prices based on Mercari up to 2026, possible pricing beyond 2026, the possible GWAP of NSW Solar Farms and the combined $/MWh revenue:

It is not possible to predict the future wholesale market. A government announcement or large generator failure can change everything overnight.
It is good to have numbers to work to though. Generally, while this article has developed and explained a forward view, project developers and potential investors are likely to consider lower and higher scenarios also.
These potential prices are interesting for PPA discussions. Often Wind or Solar PPAs are agreed at a price between $55 and $75 including wholesale electricity and LGCs. However, the 8-year and 10-year average of combined revenue are $104 and $97 per MWh respectively. While PPAs provide better revenue certainty and reduce the risk of low prices, projects that don’t need PPAs to achieve finance may prefer to not full sell their output, and instead receive wholesale revenues for part or all of their generation.
As always, it is interesting times in the wholesale market. We know this scenario shown above will not be right, but hopefully it is closer than most! If you have any questions, concerns or theories you would like to discuss with the author do not hesitate to get in touch using jonathan@komoenergy.com.au.